- It is a Software Simulation of a Machine which can Perform Operations Like a Physical Machine.
Types of Virtual Machines
- There are 2 Types of Virtual Machines
- 1. Hardware Based OR System Based Virtual Machines
- 2. Software Based OR Application Based OR Process Based Virtual Machines
1. Hardware Based OR System Based Virtual Machines
- It Provides Several Logical Systems on the Same Computer with Strong Isolation from Each Other.
- Examples:
- KVM (Kernel Based Virtual Machine) for Linux Systems
- VMware (Virtual Machine ware)
- Xen
- Cloud Computing
- The main advantage of Hard-ware based Virtual Machines is for effective utilization of hard- ware resources.
2. Software Based OR Application Based OR Process Based Virtual Machines
- These Virtual Machines Acts as Runtime Engines to Run a Particular Programming Language Application.
- Examples:
- JVM Acts as Runtime Engine to Run Java Applications
- PVM (Parrot VM) Acts as Runtime Engine to Run Scripting Languages Like PERL.
- CLR (Common Language Runtime) Acts as Runtime Engine to Run .Net Based Applications.
JVM
- JVM is the Part of JRE.
- JVM is Responsible to Load and Run Java Applications.
Basic JVM Architecture

ClassLoader Sub System:
ClassLoader Sub System is Responsible for the following 3 Activities. 1) Loading
- 1.Loading:
- 2.Linking
- Verification
- Preparation
- Resolution
- 3.Initialization
1. Loading:
- Loading Means Reading Class Files and Store Corresponding Binary Data in Method Area.
- For Each Class File JVM will Store the following Information in Method Area.
- 1) Fully Qualified Name of the Loaded Class OR Interface ORenum.
- 2) Fully Qualified Name of its Immediate Parent Class.
- 3) Whether .class File is related to Class OR Interface OR enum.
- 4) The Modifiers Information
- 5) Variables OR Fields Information
- 6) Methods Information
- 7) Constant Pool Information and so on.
- After loading .class File Immediately JVM will Creates an Object of the Type class Class to Represent Class Level Binary Information on the Heap Memory.

- The Class Object can be used by Programmer to get Class Level Information Like Fully Qualified Name of the Class, Parent Name, Methods and Variables Information Etc.
Program to print methods and variables information by using Class object:
class Student {
private String name;
private introllNo;
public String getName() {
return name;
}
public void setRollNo(introllNo) {
this.rollNo = rollNo;
}
}
class Test1 {
public static void main(String args[]) {
Student s = new Student();
Class c = s.getClass();
System.out.println(c.getName());
Method[] m = c.getDeclaredMethods();
for (int i=0; i<m.length; i++)
System.out.println(m[i]);
Field[] f = c.getDeclaredFields();
for (int i=0; i<f.length; i++)
System.out.println(f[i]);
}
}
Output
public void Student.setRollNo(int)
public java.lang.StringStudent.getName()
private java.lang.String Student.name
private intStudent.rollNo
- In the Above Example by using Student class Class Object we can get its Methods and Variable Information.
Note:
- For Every loaded .class file Only One Class Object will be Created, even though we are using Class Multiple Times in Our Application.
2.Linking:
- Linking Consists of 3 Activities
- 1) Verification
- 2) Preparation
- 3) Resolution
1. Verification:
- It is the Process of ensuring that Binary Representation of a Class is Structurally Correct OR Not.
- That is JVM will Check whether .class File generated by Valid Compiler OR Not.i.ewhether .class File is Properly Formatted OR Not.
- Internally Byte Code Verifier which is Part of ClassLoader Sub System is Responsible for this Activity.
- If Verification Fails then we will get Runtime Exception Saying java.lang.VerifyError.
2. Preparation:
- In this Phase JVM will Allocate Memory for the Class Level Static Variables and Assign DefaultValues (But Not Original Values).
- Note: Original Values will be assignedin Initialization Phase.
3. Resolution:
- It is the Process of Replaced Symbolic References used by the Loaded Type with Original References.
- Symbolic References are Resolved into Direct References by searching through Method Area to Locate the Referenced Entity.

- For the Above Class, ClassLoadersub system Loads Test.class, String.class,Student.class, andObject.class.
- The Names of these Class Names are stored in Constant Pool of Test Class.
- In Resolution Phase these Names are Replaced with Actual References from Method Area.
3. Initialization
- In this Phase All Static Variables will be assigned with Original Values and Static Blocks will be executed from fromtop to bottom and from Parent to Child.

- Note: While Loading, Linking and Initialization if any Error Occurs then we will get
- Runtime Exception Saying java.lang.LinkageError. Of course VerifyError is child class of LinkageError only.
Types of ClassLoaders
- Every ClassLoader Sub System contains the following 3 ClassLoaders.
- 1. BootstrapClassLoader OR PrimordialClassLoader
- 2. ExtensionClassLoader
- 3.ApplicationClassLoader OR SystemClassLoader
1. BootstrapClassLoader
- This ClassLoader is Responsible to load classes from jdk\jre\lib folder.
- All core java API classes present in rt.jar which is present in this location only. Hence all
- API classes (like String, StringBufferetc) will be loaded by Bootstrap class Loader only.
- Location:

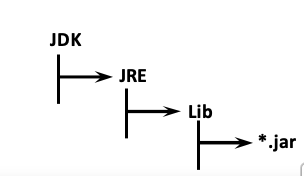
- This Location is Called BootstrapClassPath.
- That is BootstrapClassLoader is Responsible to Load Classes fromBootstrapClassPath.
- BootstrapClassLoader is by Default Available with the JVM.
- It is implemented in Native Languages Like C and C++.
2. Extension ClassLoader:
- It is the Child of Bootstrap ClassLoader.
- ThisClassLoader is Responsible to Load Classes from Extension Class Path. Location:jdk\jre\lib\ext

- This ClassLoader is implemented in Java and the corresponding .class File Name is sun.misc.Launcher$ExtClassLoader.class
Application ClassLoader OR System ClassLoader:
- It is the Child of Extension ClassLoader.
- This ClassLoader is Responsible to Load Classes from Application Class Path (Current Working Directory).
- It Internally Uses Environment Variable Class Path.
- Application ClassLoader is implemented in Java and the corresponding .
- class File Name issun.misc.Launcher$appClassLoader.class Bootstrap ClassLoader

How Java ClassLoader Works?
- ClassLoader follows Delegation Hierarchy Principle.
- Whenever JVM Come Across a Particular Class, first it will Check whether the corresponding Class is Already Loaded OR Not.
- If it is Already Loaded in Method Area then JVM will Use that Loaded Class.
- If it is Not Already Loaded then JVM Requests ClassLoaderSub System to Load that Particular Class.
- Then ClassLoaderSub System Handovers the Request to ApplicationClassLoader.
- ApplicationClassLoader Delegates that Request to ExtensionClassLoader and ExtenstionClassLoader in-turn Delegates that Request to BootstrapClassLoader.
- BootstrapClassLoader Searches in Bootstrap Class Path for the required .class File (jdk/jre/lib)
- If the required .class is Available, then it will be Loaded. Otherwise BootstrapClassLoader Delegates that Request to
- ExtensionClassLoader.
- ExtensionClassLoader will Search in Extension Class Path (jdk/jre/lib/ext). If the required .class File is Available then it will be Loaded, Otherwise it Delegates that
- Request to ApplicationClassLoader.
- ApplicationClassLoader will Search in Application Class Path (Current Working Directory). If the specified .class is Already Available, then it will be Loaded. Otherwise we will get Runtime Exception Saying ClassNotFoundExceptionOR NoClassDefFoundError.

Example:
public static void main(String[] args) {
System.out.println(String.class.getClassLoader());
System.out.println(Student.class.getClassLoader());
System.out.println(Test.class.getClassLoader());
}
}
- For String Class: From Bootstrap Class Path by Bootstrap ClassLoader Output is null
- For Student Class: From Extension Class Path by Extension ClassLoader Output is sun.misc.Launcher$extClassLoader@1234
- For Test Class:From Application Class Path by Application ClassLoader Output is sun.misc.Launcher$appClassLoader@3456
Note:
- Assume that Student.class Present in Both Extension Class Path and Application Class Path and Test.class Present in Only in Application Class Path.
- Bootstrap ClassLoader is Not Java Object. Hence we are getting null in the 1st Case but
- Extension ClassLoader and Application ClassLoader are Java Objects and Hence we get Proper Output in remaining 2 Cases.
- ClassName@HexaDecimal.String_of_Hashcode
- ClassLoader Subsystem will give Highest Priority for Bootstrap Class Path and then Extension Class followed by Application Class Path.
What is the Need of Customized ClassLoader?
- Default ClassLoader will load .class Files Only Once Eventhough we are using Multiple Times that Class in Our Program.
- After loading .class File if it is modified Outside, then Default ClassLoaderwon't Load Updated Version of Class File on Fly (Dynamically). Because .class File already there in Method Area.
- We can Resolve this Problem by defining Our Own Customized ClassLoader.
- The Main Advantage of Customized ClassLoader is we can Control Class loading Mechanism Based on Our Requirement.
- For Example we can Load Class File Separately Every Time. So that Updated Version Available to Our Program.

How to Define Our Own ClassLoader?
- We can Define Our Own Customized ClassLoader by extending java.langClassLoader Class.
- Pseudo Code to Define Customized Class Loader

What is the Purpose of java.lang.ClassLoader Class?
- This Class Act as Base Class for designing Our Own Customized ClassLoaders.
- Hence Every Customized ClassLoader Class should extendsjava.lang.ClassLoader either Directly OR Indirectly.
Various Memory Areas of JVM
- Whole Loading and Running a Java Program JVM required Memory to Store Several Things Like Byte Code, Objects, Variables, Etc.
- Total JVM Memory organized in the following 5 Categories:
- 1) Method Area
- 2) Heap Area OR Heap Memory
- 3) Java Stacks Area
- 4) PC Registers Area
- 5) Native Method Stacks Area
1) Method Area:
- Method Area will be Created at the Time of JVM Start- Up.
- It will be Shared by All Threads (Global Memory).
- This Memory Area Need Not be Continuous.
- Method area shows runtime constant pool.
- Total Class Level Binary Information including Static Variables Stored in Method Area.

2) Heap Area:
- Programmer Point of View Heap Area is Consider as Important Memory Area.
- Heap Area will be Created at the Time of JVM Start- Up.
- Heap Areacan be accessed by All Threads (Global OR Sharable Memory).
- Heap Area Nee Not be Continuous.
- All Objects and corresponding Instance Variables will be stored in the Heap Area.
- Every Array in Java is an Object and Hence Arrays Also will be stored in Heap Memory Only.

Program to Display Heap Memory Statistics
- A Java Application can Communicate with the JVM by using Runtime Object.
- Runtime Class Present in java.lang Package and it is a Singleton Class.
- We can Create Runtime Object by using
- Runtime r = Runtime.getRuntime();
- Once we got Runtime Object we can Call the following Methods on that Object.
- 1. maxMemory(): Returns Number of Bytes of Max Memory allocated to the Heap.
- 2. totalMemory(): Returns Number of Bytes of Total (Initial) Memory allocated to the Heap.
- 3. freeMemory(): Returns Number of Bytes of Free Memory Present in Heap


How to Set Maximum and Minimum Heap Size?
- Heap Memory Size is Finite, Based on Our Requirement we can IncreaseORDecrease Heap Size.
- The Default Heap Size is 64.
- We can Use the following Flags with Java Command.
-Xmx:
- To Set Maximum Heap Size. Eg: java -Xmx128m HeapDemo
- This Command will be Set as Maximum Heap Size as 128mb.


-Xms :
- To Set Minimum Heap Size. Eg:java -Xms64m HeapDemo
- This Command Set Minimum Heap Size as 64 mb.


java –Xmx128m –Xms64m HeapDemo

3) Stack Memory:
- For Every Thread JVM will Create a Separate Runtime Stack.
- Runtime Stack will be Created Automatically at the Time of Thread Creation.
- All Method Calls and corresponding Local Variables, Intermediate Results will be stored in the Stack.
- For Every Method Call a Separate Entry will be Added to the Stack and that Entry is Called Stack Frame OR Activation Record.
- After completing that Method Call the corresponding Entry from the Stack willbeRemoved.
- After completing All Method Calls, Just Before terminating the Thread,the Runtime Stack will be destroyed by the JVM.
- The Data stored in the Stack can be accessed by Only the corresponding Thread and it is Not Available to Other Threads.


Local Variable Array:
- It Contains All Parameters and Local Variables of the Method.
- Each Slot in the Array is of 4 Bytes.
- Values of Type int, float, and Referenced Variables Occupy One Entry in that Array.
- Values of Type long and double Occupy 2 Consecutive Entries in Array.
- byte, short and char Values will be converted in to int Type before storing and Occupy One Slot.
- But the Way of storing boolean Values is varied from JVM to JVM. But Most of the JVM's follow One Entry OR One Slot for boolean Values. Eg:public void m1(inti,long l, Object o, byte b, double d){}
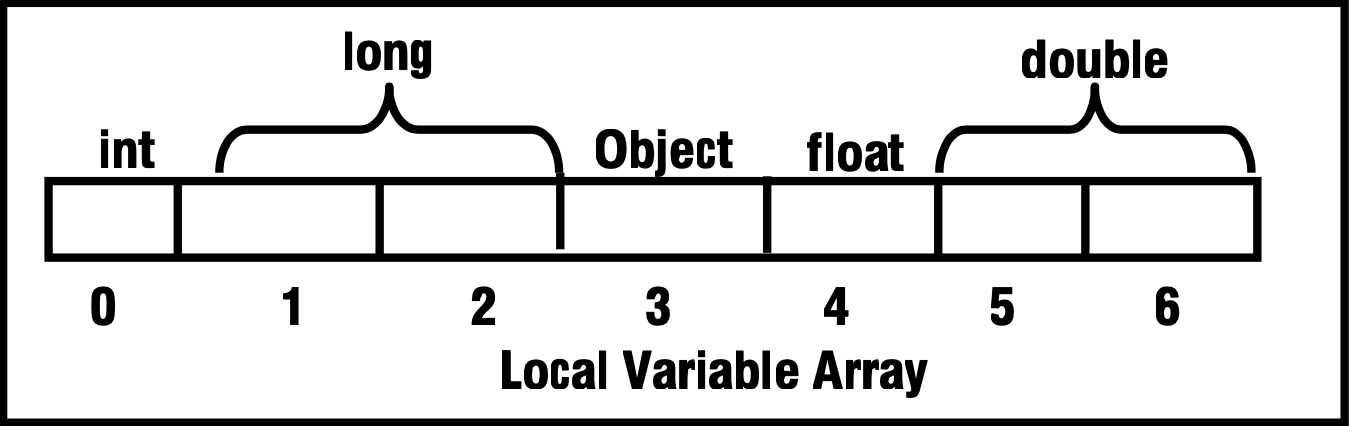
Operand Stack:
- JVM Uses Operand Stack as Work Space.
- Some Instructions can Push the Values to the Operand Stack and Some Instructions can
- Pop the Values from Operand Stack and Perform required Operations and Store Result Once Again Back to the Operand Stack.

Frame Data:
- Frame Data contains All Symbolic References (Constant Pool) related to that Method.
- It also contains a Reference to Exception Table which Provides corresponding catch Block Information in the Case of Exceptions.
4. PC (Program Counter) Registers Area:
- For Every Thread a Separate PC Register will be Created at the Time of Thread Creation.
- PC Registers contains Address of Current executing Instruction.
- Once Instruction Execution Completes Automatically PC Register will be incremented to Hold Address of Next Instruction.
5) Native Method Stacks:
- For Every Thread JVM will Create a Separate Native Method Stack.
- All Native Method Calls invoked by the Thread will be stored in the corresponding Native Method Stack.
Note:
- Method Area, Heap Area and Stack Area are considered as Major Memory Areas with Respect to Programmers Point of View.
- Method Area and Heap Area are for JVM. Whereas Stack Area, PC Registers Area and Native Method Stack Area are for Thread. That is
- One Separate Heap for Every JVM
- One Separate Method Area for Every JVM
- One Separate Stack for Every Thread
- One Separate PC Register for Every Thread
- One Separate Native Method Stack for Every Thread
- Static Variables will be stored in Method Area whereas Instance Variables will be stored in Heap Area and Local Variables will be stored in Stack Area.
Execution Engine
- This is the Central Component of JVM.
- Execution Engine is Responsible to Execute Java Class Files.
- Execution Engine contains 2 Components for executing Java Classes.
- 1.Interpreter
- 2.JIT Compiler
1. Interpreter:
- It is Responsible to Read Byte Code and Interpret (Convert) into Machine Code (Native Code) and Execute that Machine Code Line by Line.
- The Problem with Interpreter is it Interpreters Every Time Even the Same Method Multiple Times. Which Reduces Performance of the System.
- To Overcome this Problem SUN People Introduced JIT Compilers in 1.1 Version.
2. JIT Compiler:
- The Main Purpose of JIT Compiler is to Improve Performance.
- Internally JIT Compiler Maintains a Separate Count for Every Method whenever JVM Come Across any Method Call.
- First that Method will be interpreted normally by the Interpreter and JIT Compiler Increments the corresponding Count Variable.
- This Process will be continued for Every Method.
- Once if any Method Count Reaches Threshold (The Starting Point for a New State) Value, then JIT Compiler Identifies that Method Repeatedly used Method (HOT SPOT).
- Immediately JIT Compiler Compiles that Method and Generates the corresponding Native Code. Next Time JVM Come Across that Method Call then JVM Directly Use Native Code and Executes it Instead of interpreting Once Again. So that Performance of the System will
- be Improved.
- The Threshold Count Value varied from JVM to JVM.
- Some Advanced JIT Compilers will Re-compile generated Native Code if Count Reaches
- Threshold Value Second Time, So that More optimized Machine Code will be
- generated.
- Profiler which is the Part of JIT Compiler is Responsible to IdentifY HOT SPOTS.
Note:
- JVM Interprets Total Program Line by Line at least Once.
- JIT Compilation is Applicable Only for Repeatedly invoked Methods. But Not for EveryMethod.

Java Native Interface (JNI):
- JNI Acts as Bridge (Mediator) between Java Method Calls and corresponding Native Libraries.
- Eg:hashCode()


1) Magic _Number
- The 1st 4 Bytes of Class File is Magic Number.
- This is a Predefined Value to Identify Java Class File.
- This Value should be 0XCAFEBABE.
- JVM will Use this Magic Number to Identify whether the Class File is Valid OR Not i.e. whether it is generated by Valid Compiler OR Not.
Note:
- Whenever we are executing a Java Class if JVM Unable to Find Valid Magic Number then we get RuntimeException Saying ClassFormatError: incompatible magic value.
2) Minor_Version and Major _Version
- Minor and Major Versions Represents Class File Version.
- JVM will Use these Versions to Identify which Version of Compiler Generates Current file

Note:
- Higher Version JVM can Always Run Lower Version Class Files But Lower Version JVM can’t Run Class Files generated by Higher Version Compiler.
- Whenever we are trying to Execute Higher Version Compiler generated Class File with Lower Version JVM we will get RuntimeException Saying java.lang.UnsupportedClassVersionError: Employee (Unsupported major.minor version 51.0)
3) Constant_Pool_Count:
- It Represents the Number of Constants Present in Constant Table of the Class.
4) Constant_Pool[]:
- It Represents Information About Constants Present in Constant Table of the Class.
5) Access_Flash:
- It Shows the Modifiers which are declared for the Current Class OR Interface.
6) this_class:
- It Represents the Name of the Class OR Interface defined by Class File.
7) super_class:
- It Represents the Name of the Super Class Represented by Class File.


8) interface_count:
- It Represents Number of Interfaces implemented by Current Class File.
9) interface[]:
- It Represents the Names of Interfaces which are implemented by Current Class File.
10) fields_count:
- It Represents Number of Fields Present in the Current Class File.
11) fields[]:
- It Provides Names of All Fields Present in the Current Class File.
12) method_count:
- It Represents Number of Methods Present in the Current Class File.
13)methods[]:
- It Returns the Name of the Method Present in the Current Class File.
14) attributes_count:
- It Represents Number ofAttributes Present in the Current Class File.
15)attributes[]:
- It Provides Information About All Attributes Present in the Current Class File.


